Index > The third party queue
In this section, we’ll deploy a queue-solution made by a third party, to our cluster. Then we’ll use this queue to trigger speedtest-logger from speedtest-scheduler.
Remember speedtest-scheduler?
Finally the time has come to do something with speedtest-scheduler! Before we can deploy it to Kubernetes, we’ll need to build a Docker container, and push it to our private container registry.
But first we will need to clone the source code for the scheduler. To do that, run:
$> git clone https://github.com/k8s-101/speedtest-scheduler.git
Navigate into speedtest-scheduler and build an image from the Dockerfile:
$ speedtest-scheduler> docker build -f Dockerfile -t k8s101registry.azurecr.io/speed-test-scheduler:0.0.1 ./
This time we’re tagging the image with the registry address when we build the container, so make sure you use the address of your registry.
Then we have to push the image:
$ speedtest-scheduler> docker push k8s101registry.azurecr.io/speed-test-scheduler:0.0.1
What queue? KubeMQ!
At this point we could use whatever queue we want, but we have chosen to go for KubeMQ. KubeMQ is a easy to use real-time scalable message queue, designed to support high volume messaging with low latency and efficient memory usage. It supports multiple messaging patterns, including real-time pub/sub, witch is what we are going to be using.
Deploy KubeMQ and KubeMQ-dashboard
There are many nice things about third-party applications, one of then is that many have deployed the same solution before. And in combination with docker, and easy sharing of docker-containers through container-registries, the deployment process is much easier then on a native setup. In this case the creators of KubeMQ have already created a docker image with all the necessary dependencies installed.
There is a couple of ways we could deploy KubeMQ. One way is by using KubeMQ’s ready made helm-chart, witch have all the recommended configuration for kubernetes. But since we are going to be looking at Helm in a later section, we are going to do this the “native way”.
Don’t despair, as with the other applications, we’ve prepared the configuration files for you. Start by taking a look at Deployment/kubeMQ.yaml.
This file configures both the KubeMQ-queue and a KubeMQ-dashboard. First lets take a look at the KubeMQ-queue, which is deploy as a StatefulSet. StatefulSet is a component used to manage multiple replicas of a stateful application. In this case the stateful application is our KubeMQ that we pull down from KubeMq’s container registery.
#
apiVersion: apps/v1
    kind: StatefulSet
    metadata:
      name: kubemq-cluster
    spec:
      selector:
        # This is how the statefulSet finds it's replicas. You will ses that this label matches the metadata.label under.
        matchLabels:
          app: kubemq-cluster
      replicas: 1  # How many replicas should be created
      serviceName: kubemq-cluster
      template:
        # Labels to categorize the pod
        metadata:
          labels:
            app: kubemq-cluster

        # The recipe on how kubernetes should create a container
        spec:
          containers:
          # A list of environment variables.
            - env:
                - name: KUBEMQ_LOG_LEVEL
                  value: '1'
                - name: METRIC_STORAGE_INTERVAL
                  value: '60'
                - name: KUBEMQ_TOKEN
                  value: 60321dd4-779b-409e-a4dc-ff1525a0e4ff
                - name: CLUSTER_ROUTES
                  value: 'kubemq-cluster:5228'
                - name: CLUSTER_PORT
                  value: '5228'
                - name: CLUSTER_ENABLE
                  value: 'false'
                - name: KUBEMQ_LOG_LEVEL
                  value: '2'
                - name: GRPC_PORT
                  value: '50000'
                - name: REST_PORT
                  value: '9090'
                - name: KUBEMQ_PORT
                  value: '8080'
              image: 'kubemq/kubemq:latest' # The latest KubeMq image from kubeMQ.
              imagePullPolicy: IfNotPresent
              name: kubemq-cluster
               # A list of ports that can be used from outside the Pod/image.
              ports:
                - containerPort: 50000
                  name: grpc-port
                  protocol: TCP
                - containerPort: 8080
                  name: metrics-port
                  protocol: TCP
                - containerPort: 9090
                  name: rest-port
                  protocol: TCP
                - containerPort: 5228
                  name: cluster-port
                  protocol: TCP
          restartPolicy: Always  # If the pod is terminated/crashes, it should always be restarted
For anyone to be able to reach our queue we need to create a Service. There are many kinds of services, all with different properties. This service is a LoadBalancer, which uses azures loadbalancer to create an external ip.
# The Service to KubeMQ

apiVersion: v1
    kind: Service
    metadata:
      name: kubemq-cluster
    spec:
      ports:
        - name: metrics-port
          port: 8080
          protocol: TCP
          targetPort: 8080
        - name: grpc-port
          port: 50000
          protocol: TCP
          targetPort: 50000
        - name: cluster-port
          port: 5228
          protocol: TCP
          targetPort: 5228
        - name: rest-port
          port: 9090
          protocol: TCP
          targetPort: 9090
      sessionAffinity: None
      type: LoadBalancer #  Type of service. The LoadBalancer makes this service reachable from outside the cluster.

      # The selector is used to select all the pods that this service should be pointing at.
      selector:
        app: kubemq-cluster
This is all the necessary configuration to get the queue up and running. Now we need to configure the dashboard. The dashboard is a stateless webpage, so we don’t need to use a StatefulSet to handle multiple pods. Instead we use a Deployment, which is a kind of recipe on how kubernetes should create a ReplicaSet and Pods. It also defines a desired state in which we want the components to run and how many of them.
In our case the Deployment defines how the pod should be created, like what environment variables to use and where to pull images from. It also defines how many replicas we want.
apiVersion: v1
kind: List
items:
  - apiVersion: apps/v1
    kind: Deployment
    metadata:
      name: kubemq-dashboard-deployment
      labels:
        app: kubemq-dashboard

    # The description of our desired state.
    spec:
      replicas: 1 # We want 1 replica
      selector:
        matchLabels:
          app: kubemq-dashboard
      template: # We want the container to be created in this fashion.
        metadata:
          labels:
            app: kubemq-dashboard
        spec:
          containers:
            - name: kubemq-dashboard # Give the container this name
              image: 'kubemq/kubemq-dashboard:latest' # Pull this image
              env: # Set this environment variables
                - name: SOCKET_API
                  value: 'ws://51.144.52.132:8080/v1/stats/'
                - name: DASHBOARD_API
                  value: '//51.144.52.132:8080/v1/stats/'
              ports: # Open this port into the container
                - containerPort: 80
And since we want to be able to access the dashboard from outside the cluster, we need to create a Service.
- kind: Service
  apiVersion: v1
  metadata:
    name: kubemq-dashboard
  spec:
    type: LoadBalancer
    selector:
      app: kubemq-dashboard
    ports:
      - protocol: TCP
        port: 80
With that out of the way, we’re ready to deploy KubeMQ using kubectl apply.
$ speedtest-scheduler> kubectl apply -f Deployment/kubeMQ.yaml
statefulset.apps/kubemq-cluster created
service/kubemq-cluster-node created
service/kubemq-cluster created
deployment.apps/kubemq-dashboard-deployment created
service/kubemq-dashboard created
Since we don’t have any ingress-controller/proxy (eg. nginx-ingress) (this is a subject in a later section), we have to update the kubeMQ.yaml with some ip addresses.
First we need to get the external ip for kubemq-cluster service by going to the dashboard, as we did in the previous section, or by running the following: kubectl get service kubemq-cluster.
$> kubectl get service kubemq-cluster
NAME             TYPE           CLUSTER-IP    EXTERNAL-IP     PORT(S)                                                        AGE
kubemq-cluster   LoadBalancer   10.0.88.109   51.144.52.132   8080:32419/TCP,50000:30985/TCP,5228:32465/TCP,9090:30551/TCP   20m
In this case the external ip is 51.144.52.132. It may take a few minutes for azure to get the external ip, so just be patient if it doesn’t show up right away.
Then go back to kubeMQ.yaml, and update it with the external ip.
#kubeMQ.yaml

#...
containers:
  - name: kubemq-dashboard
    image: 'kubemq/kubemq-dashboard:latest'
    env:
      - name: SOCKET_API
        value: 'ws://<external ip>:8080/v1/stats/'
        name: DASHBOARD_API
        value: '//<external ip>:8080/v1/stats/'
#...
Finally deploy KubeMQ again with kubectl apply.
$ speedtest-scheduler> kubectl apply -f Deployment/kubeMQ.yaml
statefulset.apps/kubemq-cluster configured
service/kubemq-cluster unchanged
deployment.apps/kubemq-dashboard-deployment configured
service/kubemq-dashboard unchanged
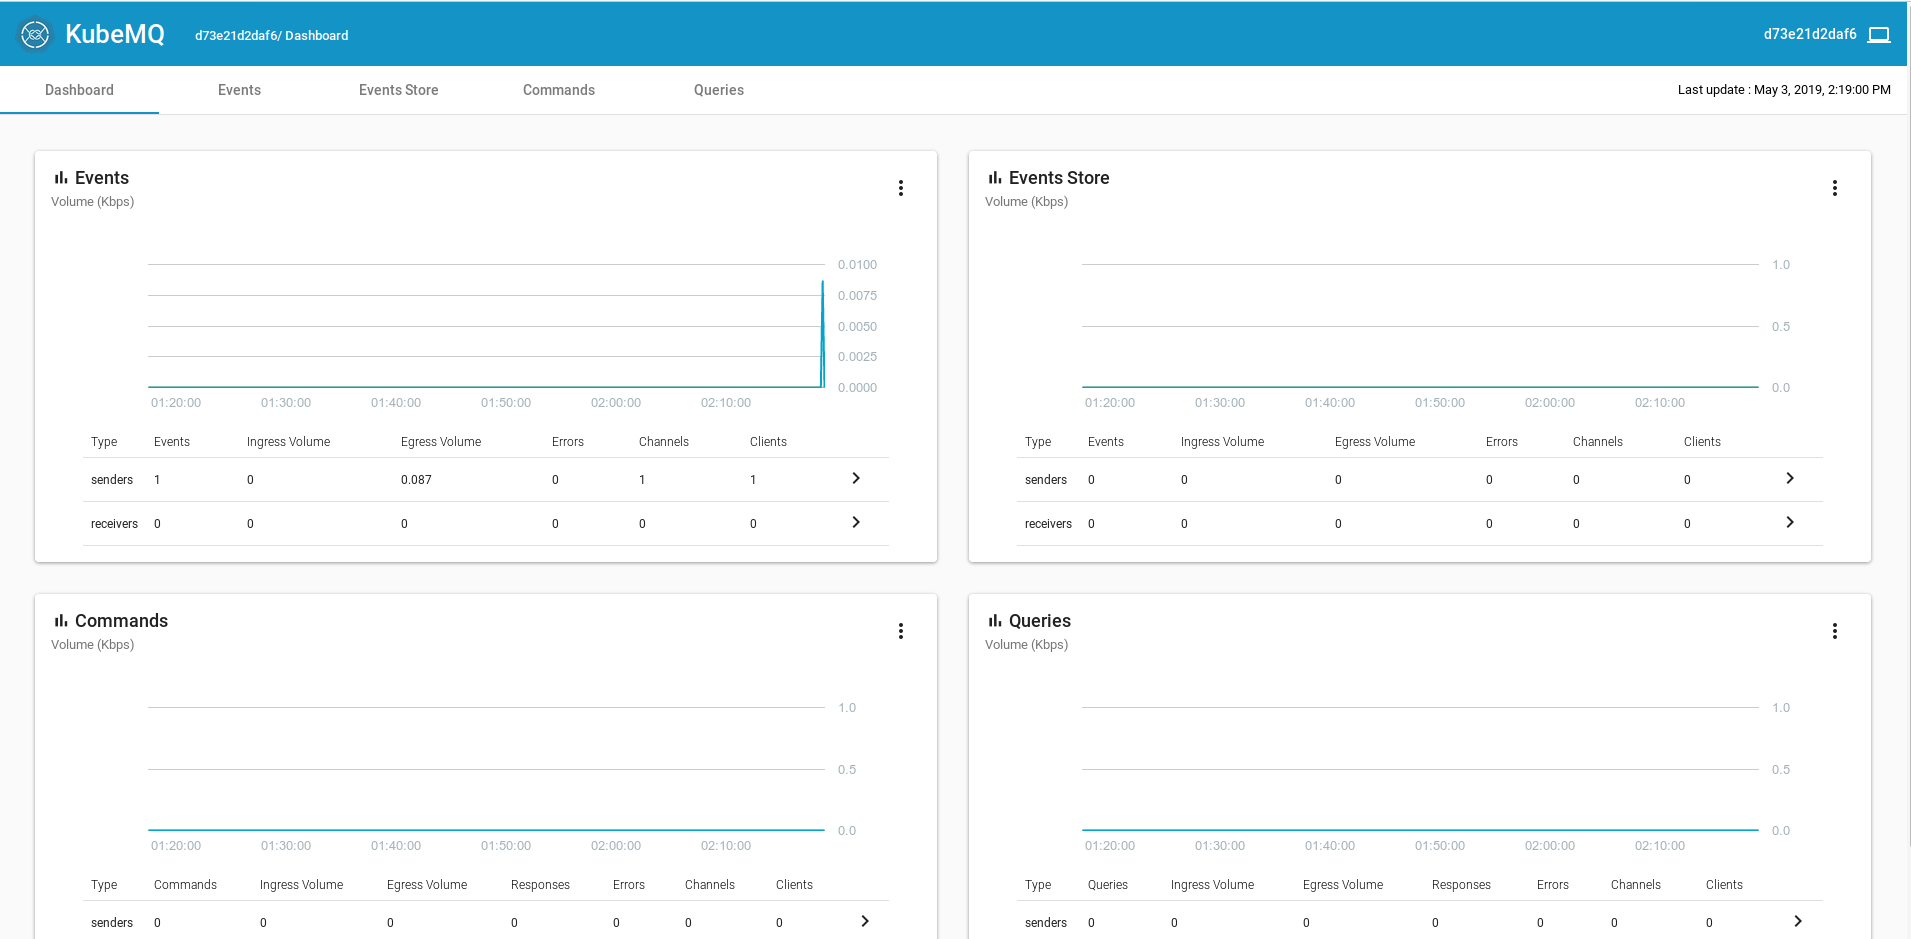
Now the KubeMQ-dashboard should be up and running, and we only need to find on which external ip the KubeMQ-dashboard in order to view it in the browser. Again find the id by running kubectl get service kubemq-dashboard or using the Kubernetes dashboard.
$> kubectl get service kubemq-dashboard
NAME               TYPE           CLUSTER-IP     EXTERNAL-IP    PORT(S)        AGE
kubemq-dashboard   LoadBalancer   10.0.168.217   13.69.25.137   80:30356/TCP   3m
If you open the browser at http://externalip (in this case http://13.69.25.137) you should be able to view the KubeMQ-dashboard.

With that out of the way, it’s time to make speedtest-scheduler post some events to the queue!
Publishing events to the queue from speedtest-scheduler.
Now that vi have a queue running, its time to create some events with the speedtest-scheduler. Open speedtest-scheduler.yaml and update the following fields.
#speedtest-scheduler.yaml

#...
schedule: "0 * * * *" # scheduled to run every hour.
  jobTemplate:
    spec:
      template:
        metadata:
          labels:
            app: speedtest-scheduler
        spec:
          imagePullSecrets:
            - name: regcred # Update this with your secret name
          containers:
            - name: speedtest-scheduler
              image: k8s101registry.azurecr.io/speed-test-scheduler:0.0.1 # Updated this with your image tag.
              env:
                - name: KubeMQ_Channel
                  value: speedtest
#...
Then deploy speedtest-scheduler with kubectl apply as usual.
$ speedtest-scheduler> kubectl apply -f Deployment/speedtest-scheduler.yaml
cronjob.batch/speedtest-scheduler-cronjob created
The job is configured to run every hour, but you can trigger a run manually from the kubernetes-dashboard or with: kubectl create job.
$> kubectl create job --from=cronjob/speedtest-scheduler speedtest-scheduler-manual-001
job.batch/speedtest-scheduler-manual-001 created
To see if the job has successful you can run kubectl get jobs. If you want to check if the events was sent to the queue, go to the KubeMQ-dashboard from the previous section.
Configuring speedtest-logger to read events from the queue
The speedtest-logger has a hidden feature, it can run as a service if the config variable singleRun is set to false. In this mode speedtest-logger will connect to an KubeMQ-instance, and listen for events from the scheduler.
Since we’re no longer going to deploy something that is a single run job, creating a Kubernetes Job is the wrong choice. Instead speedtest-logger is acting like a service, along the lines of speedtest-api, so we should instead use a Deployment. In addition we’ll need to configure the KubeMQ-variables we ignored previously.
Let’s have a look at the Deployment in speedtest-logger/Deployment/speedtest-logger-deployment.yaml.
apiVersion: apps/v1beta1
kind: Deployment
metadata:
  name: speedtest-logger
spec:
  replicas: 1
  template:
    metadata:
      labels:
        app: speedtest-logger
    spec:
      imagePullSecrets:
        - name: regcred
      containers:
        - name: speedtest-logger
          image: k8s101registry.azurecr.io/speed-test-logger:0.0.1 # Remember to update this to use your container registry address
          imagePullPolicy: Always
          ports:
            - containerPort: 80
          env:
            - name: singleRun
              value: 'false'
            - name: speedTestApiUrl
              value: http://speedtest-api-service
            - name: KubeMQ_ServerAddress
              value: kubemq-cluster-node:50000 # Note we use the same service her as in the speedtest-scheduler
            - name: KubeMQ_Channel
              value: speedtest
The structure of this deployment is very similar to the one used by speedtest-api and speedtest-web. The main difference is that we won’t create a service for the speedtest-logger, because we only have one instance of the logger, and we don’t need to access it from outside the cluster.
Now we can deploy the new speedtest-logger deployment.
$ speedtest-logger> kubectl apply -f Deployment/speedtest-logger-deployment.yaml
deployment "speedtest-logger" created
You can visit the Kubernetes dashboard to view the new Deployment, and while you’re there, you can delete the old Job for speedtest-logger.
KubeMQ is configured to not remember any messages, so in order to trigger speedtest-logger, we’ll need to run speedtest-scheduler again:
$> kubectl create job --from=cronjob/speedtest-scheduler speedtest-scheduler-manual-002
job.batch/speedtest-scheduler-manual-002 created
Let’s check if the event was sent to the queue, and that the logger has received it. Open the KubeMQ-dashboard from the previous section and have a look.
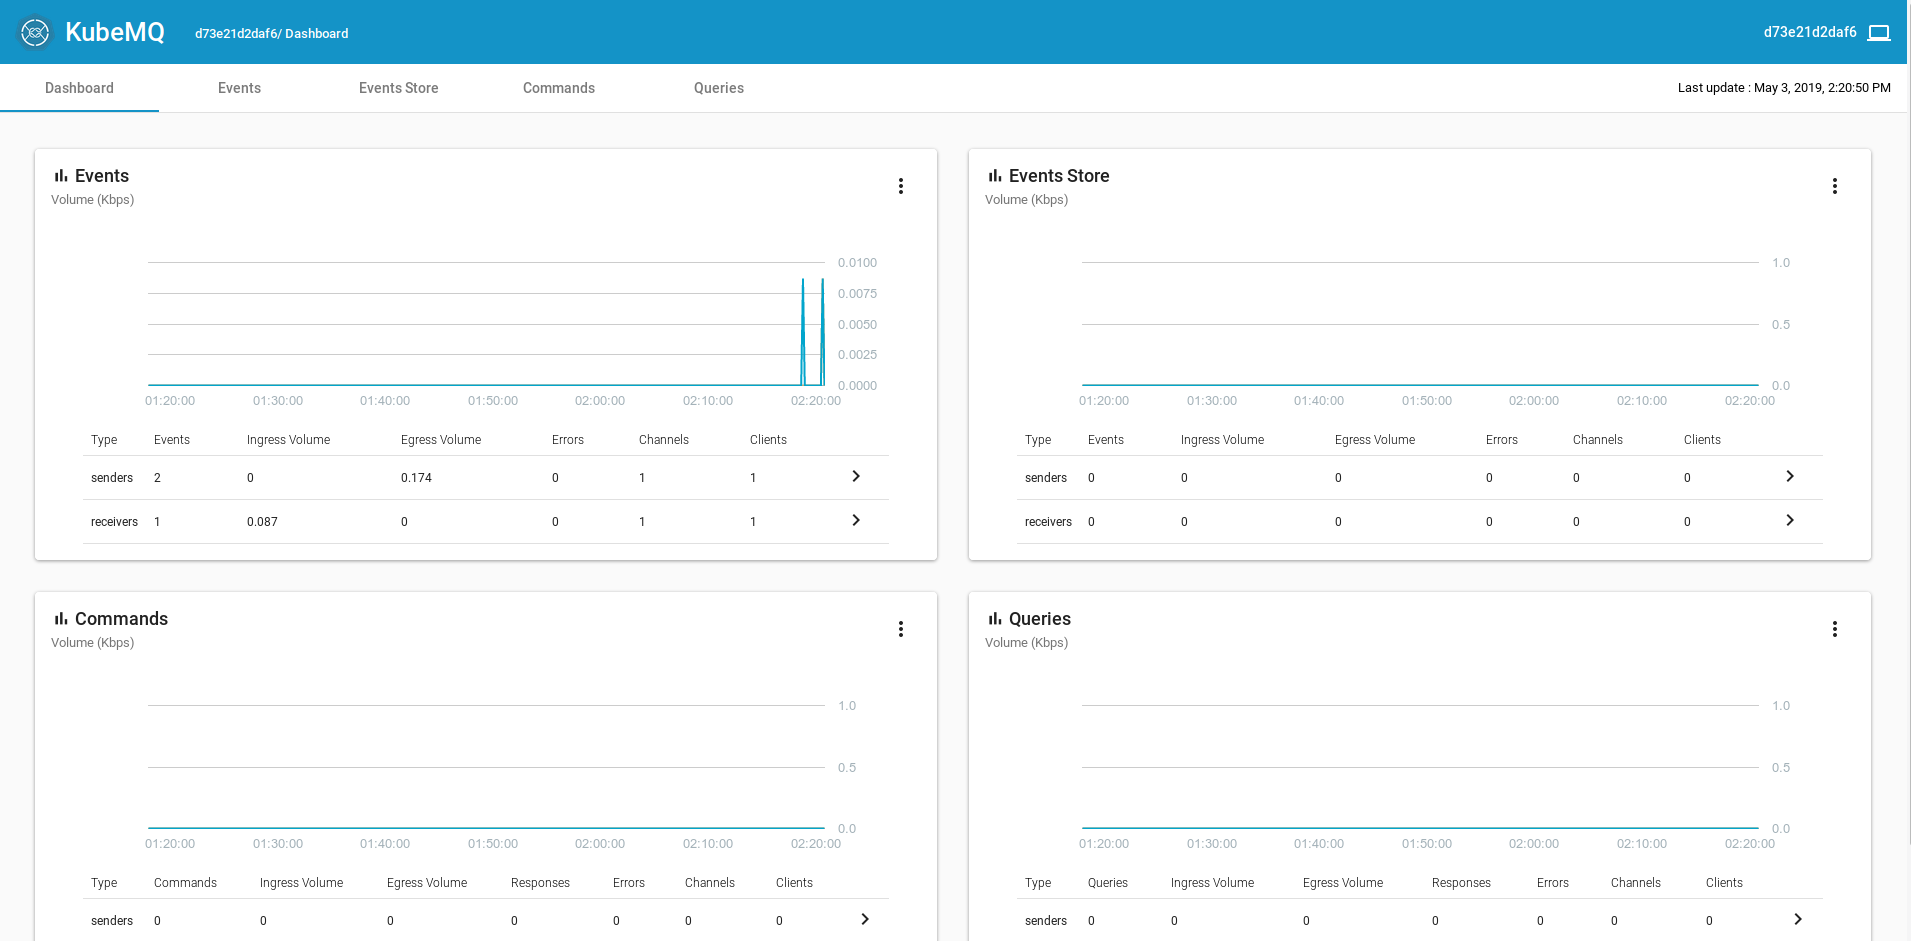
You can also have a look at speedtest-web and see if you have a new speedtest result.
What now?
Congratulations! You just completed the basic part of this workshop. Going forward we’ll visit more advanced topics, starting with Helm, the package manager for Kubernetes.